
Jonathan Landy
In this back-to-basics post, we review three results from safety stock theory that can help retailers to maintain a lean inventory without compromising service levels. Key insights:
-
Stockouts can’t be eliminated entirely—the goal is to balance acceptable stockout risk against inventory costs.
-
The two major drivers of stockout risk are uncertainty in customer demand and supplier lead time—reducing either lets you run leaner.
-
Operational discipline matters: Selecting—and sticking to—a consistent reorder strategy allows you to hit your target service level at a lower average inventory level.
Illustrative plots ahead!
Introducing Acme Inc.
In this post, we’ll consider the operations of Acme Inc., a hypothetical business selling a single product—a widget. Daily demand averages 500 units with a standard deviation of 200. The warehouse attempts to maintain inventory to meet this fluctuating demand. Fig. 1 shows a simulated demand plot.
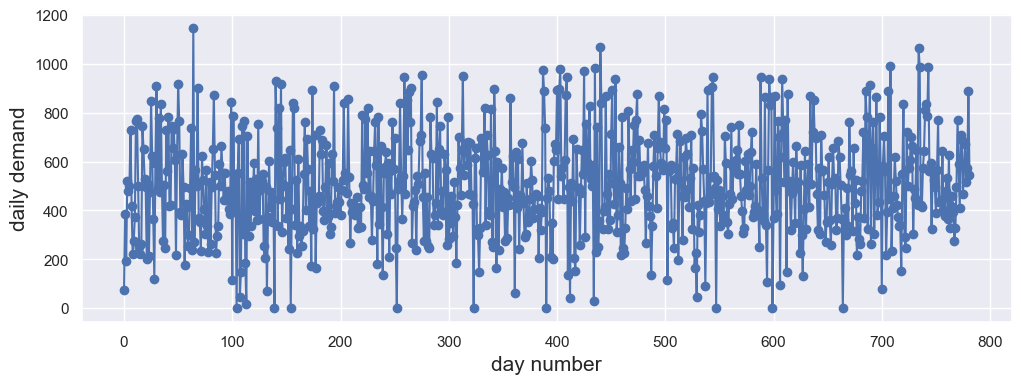
Fig 1. Example demand plot. Our hypothetical company sells 500 200 widgets per day.
When widget supply falls to an agreed upon "triggering" level, the company places an order for 40,000 more units. Delivery timing is uncertain—the order might arrive in 3 to 9 weeks, averaging 6. If demand spikes or the shipment is delayed, a stockout can occur, leading to missed sales. Fig. 2 shows an example inventory trace, with stockouts highlighted in red.
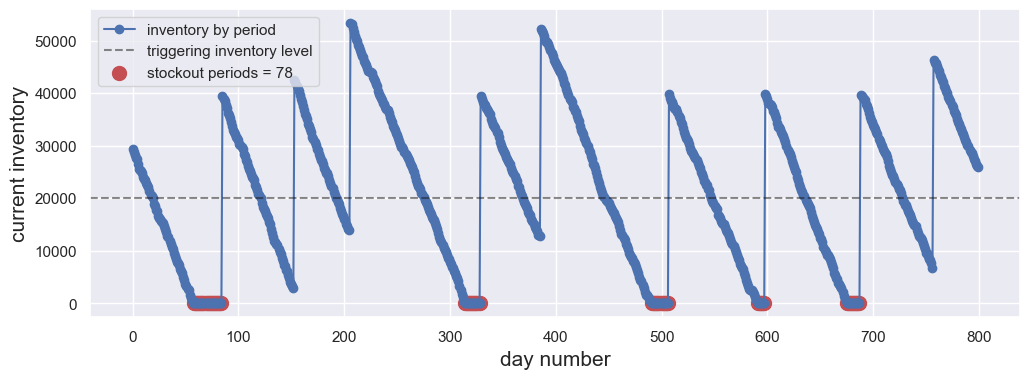
Fig 2. Example supply plot. Acme places an order for 40,000 units whenever the inventory dips below the black dashed line (here, 20,000 units). When inventory arrives, it spikes up in the plot. In this example, delivery delays and / or hot demand have caused stockouts to occur in 78 of the ~800 simulated days.
In the following sections, we'll explore how the stockout rate depends on various factors characterizing the system—each of which can often be controlled to improve outcomes.
Adjusting purchase behavior
In the above example, Acme triggered a reorder whenever inventory dropped below 20,000 units—enough to cover about 40 days of average demand. Since it typically takes 6 weeks (42 days) for new inventory to arrive, the 40-day buffer was sufficient to prevent any stockout before shipment arrival about half the time. Still, the simulation showed 78 days of stockout—about 10% of the total period.
How to reduce the stockout rate? One option is to order more inventory each time but keep the trigger level the same. That does help—but it turns out to not be the most efficient move. A better approach (at least when stockouts are relatively rare) is to raise the reorder trigger while keeping the order size fixed.
When you raise the trigger level, you’ll end up holding more inventory on average. That’s the tradeoff: higher average holding costs versus fewer stockouts. Fig. 3 shows this tradeoff for Acme's system: a plot of mean inventory held versus fraction of time in stockout, based on simulations at different trigger points.
Seeing this plot, Acme's COO decided they should move from their current ~10%+ mean stockout rate to 5%. This turns out to require triggering a reorder when inventory dips below 26,000 units, rather than 20,000. If they could hit this each time, the average number of units on hand would then be around 27,000, vs 21,000 before. This raises holding costs, but the reduction in stockout rate makes this an economical tradeoff in their case.
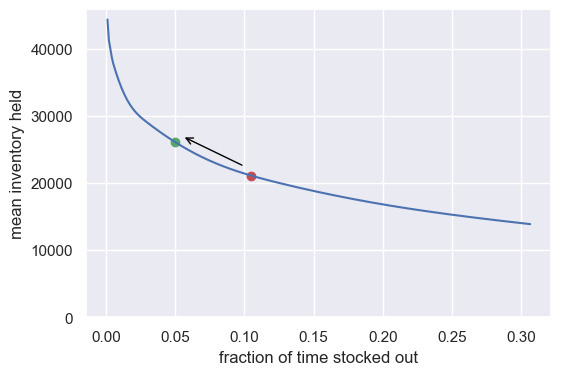
Fig 3. Mean inventory held versus fraction of time stocked out for Acme Inc. Each point comes from a simulation run with a different trigger level. Triggering an order earlier (before stock dwindles too much) leads to higher inventory levels on average, but also suppresses time in stockout. Note that it's quite difficult to suppress stockout completely. Acme decided to move to the green operating point.
Stick with it!
One method to reduce the cost of maintaining a high service level—or low stockout rate—is to follow a consistent reordering rule. This works because the tradeoff curve between inventory and stockout rate is "convex".
We illustrate this in Fig. 4, comparing two scenarios. In the first, reordering is haphazard: Acme's frazzled operations team sometimes orders early leading to a stockout rate near 1%, other times late, giving a stockout rate closer to 9%. While the average stockout rate is 5%—hitting their target—maintaining it requires about 30,000 units of inventory on average (the red point on the plot).
In the second "disciplined" scenario, Acme maintains a consistent process, hitting 5% stockout rate at all times. This produces the green point, bringing them back to the 27,000 unit average inventory—a 10% reduction!
The takeaway: simply sticking to a consistent operational process can meaningfully cut inventory costs.
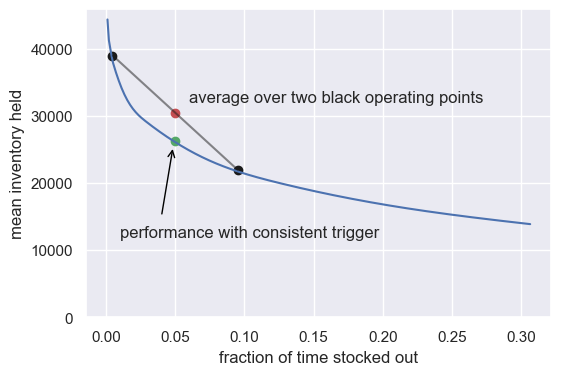
Fig 4. Because the tradeoff curve is convex, maintaining a consistent stockout rate leads to a lower average inventory than switching between extremes. Compare the green point (steady reordering) versus the red point (average result from switching between the two black points).
Reducing uncertainty
A second way to reduce the cost of maintaining a high service level is to lower the system’s uncertainty. In Acme Inc.'s case, demand uncertainty is much less likely to cause a stockout than shipment arrival time uncertainty. This is because the mean delivery lead time is relatively long, giving the daily demand fluctuations time to average out. However, if the daily demand uncertainty were larger, or if the lead times were shorter, demand variability would play a larger role.
For Acme, the biggest opportunity then is to stabilize the supply chain and make delivery times more predictable. Realizing this, the team streamlined their supply chain and managed to reduce their delivery variability, moving from a range of 3–9 weeks to 5–7 weeks. The benefits show up clearly in the updated plot below: The mean inventory Acme needs to maintain their 5% stockout rate is reduced by 25%!
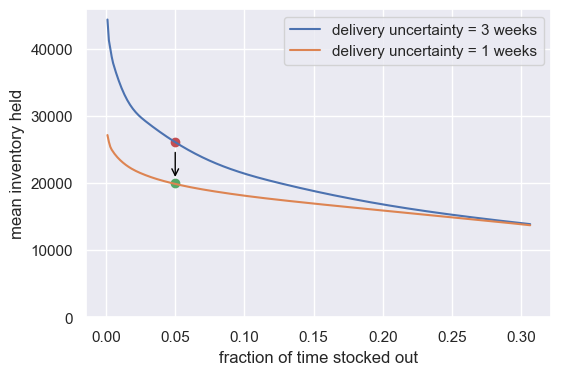
Fig 5. After stabilizing delivery times (cutting variability from three weeks down to one), Acme is able to cut mean inventory level by 25%.
Summary
Safety stock management is about striking the right balance between two competing risks: tying up too much capital in inventory versus missing sales due to stockouts. By understanding your demand and lead time variability, and using either simulation or standard statistical formulas, you can map out the tradeoff curve and then select an operating point that fits your business goals.
To decide the right operating point, you'll need to weigh the cost of carrying extra inventory against the cost of missed sales. Margins play a key role here, as does the possibility that customers might substitute another product from your inventory if the primary item is out of stock.
Whatever your choice, simply sticking to a consistent approach will allow your business to maintain its current average service level with leaner inventory. Further, this sets your business up with a virtuous cycle: Any other operational improvements that improve reliability, either in demand or shipment arrival times, will end up further reducing costs thanks to this process. Acme Inc. is an exemplar—taking this approach they dropped their inventory footprint by 35%. Go Acme!
About VarietyIQ
VarietyIQ helps retailers and brands optimize inventory decisions — from forecasting and allocation to pricing and product mix. We combine advanced data science with deep retail expertise to improve efficiency, profitability, and growth.
Need help optimizing your purchase orders? Get in touch — we’d love to connect.
Thanks to Jaireh Tecarro for creating the header for this post.

