Jonathan Landy
E-commerce apparel return rates today average around 20% — but this average is rising, and rates on individual products vary widely. In this post, we introduce simple equations to estimate an item’s expected profit and margin based on its return rate, damage rate, and price.
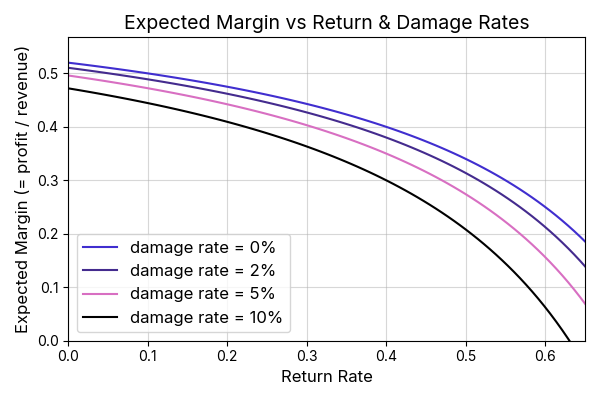
Inventory managers can use these formulas to assess true profitability across their assortment over time. For example, when the return rate hits 40% — a realistic figure for a hard-to-size item — the margin can fall to half of its ideal level.
Expected profit and margin formulas
We assume the item has the following characteristics:
- = return rate (item is returned but not damaged)
- = damage rate (item is returned or lost in a way that requires a full write-off)
- = average unit cost to the retailer
- = average retail price
- = operations cost per shipment (shipping + logistics, etc.)
From these, we derive the following formula (see appendix for derivation):
The first two terms reflect the “ideal” profit – price minus unit cost. The third term accounts for average operational expenses, and the fourth for expected losses due to damage. This last is an approximation that holds well when – a condition that typically holds in practice.
To compute expected margin, we have to divide (1) by the expected revenue per item. This gives,
Both (1) and (2) decrease with and .
Example
Consider an item with , , $, $, and $. The ideal margin – based solely on cost vs price – is
But using formula (2), the actual margin drops to
If returns rise to (perhaps the garment sizing is hard to judge online), margin drops further
If the damage rate is also increased to , margin goes to
half the ideal (3).
A company with $10 million in annual revenue would have $7 million to cover HQ costs under margin (3), $4.6 million under margin (4), $3.8 million under margin (5), and just $3.5 million under margin (6). We conclude that working to keep return and damage rates down can pay off meaningfully for e-commerce brands.
The plot below shows how margin varies with return rate across a few values of .

Figure 1: Margin vs return and damage rate, using: $, $, and $, as above.
Appendix: Derivations
With return-without-damage rate , the expected number of shipments needed to sell an item is
With a cost of per shipment, total expected operational costs are then
If damage occurs independently with probability per shipment, and damage is rare (), then the expected loss to damage is approximately:
Here, we assume that an item that is damaged cannot be sold, and so we lose the sale price when this happens. Putting these together with the basic price-cost difference yields the expected profit formula (1).
To get to margin, we have to divide (1) by the expected revenue per item. This is
Doing this and keeping results only up to first order in gives (2).
About VarietyIQ
VarietyIQ helps retailers and brands optimize inventory decisions — from forecasting and allocation to pricing and product mix. We combine advanced data science with deep retail expertise to improve efficiency, profitability, and growth.
Need help analyzing your effective margin by product? Get in touch — we’d love to connect.
Thanks to Jaireh Tecarro for creating the header image for this post and to Luke Judson for helpful conversations relating to this post.

